Manage Reports
Reports module can be used to generate different reports within the Data Governance Tool. The dashboard shows all the system-defined and user-defined reports within the drop-down menu, and the Manage Reports can be used to create four types of reports -- Data Governance, Retention, Survey Distribution and Department Reports.
You can create two types of reports through the Manage Reports feature -- Pre-defined and Custom-defined. Any report created here will appear in the Reports dashboard within a drop-down menu. Refer to the Reports Overview.docx guide to access all the reports generated.
Pre-defined Reports -- can be used to create Data Governance and Retention Reports
Custom-defined Reports -- can be used to create Survey Distribution and Department Reports.
To create a new report,
- Log into the Data Governance tool.
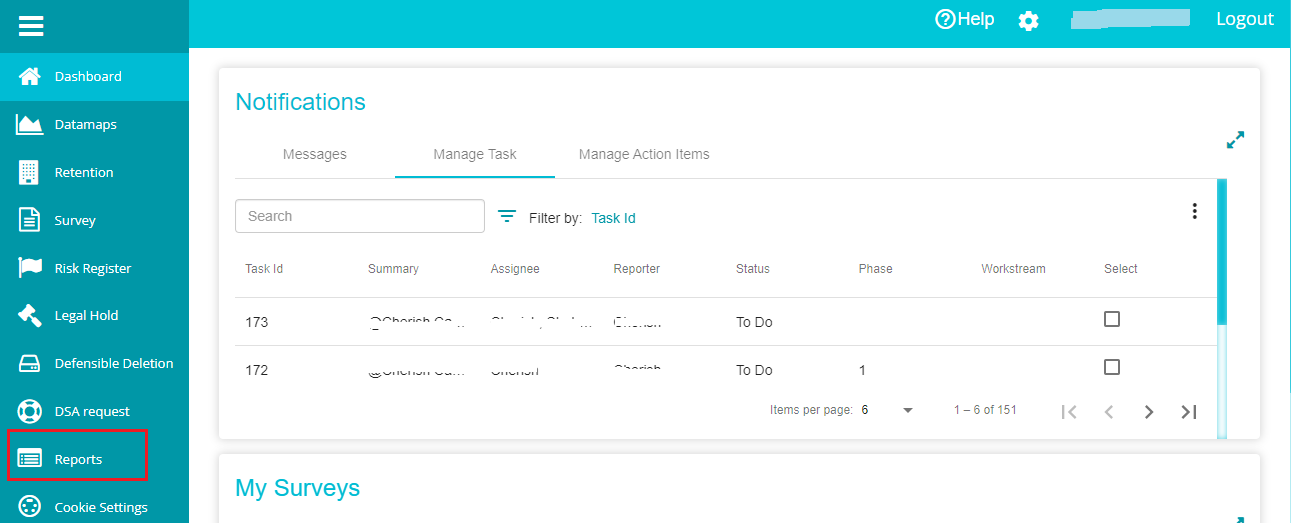
Click on the hamburger
 icon to open the menu.
Select 'Reports' from the menu.
- Click on the
 button on the screen.
This selection takes you to the Manage Reports Dashboard, where you can find the existing reports and can create a new one.
Note: select any report from the 'Reports' list on the screen and edit the necessary details if you don't want a report like an existing one. Report Title and Index are frozen in this case, and the rest can be modified at requirement.
A) Predefined Reports
These reports run through five stages -- initialize, distribute setting, field setting, filters, and generate.
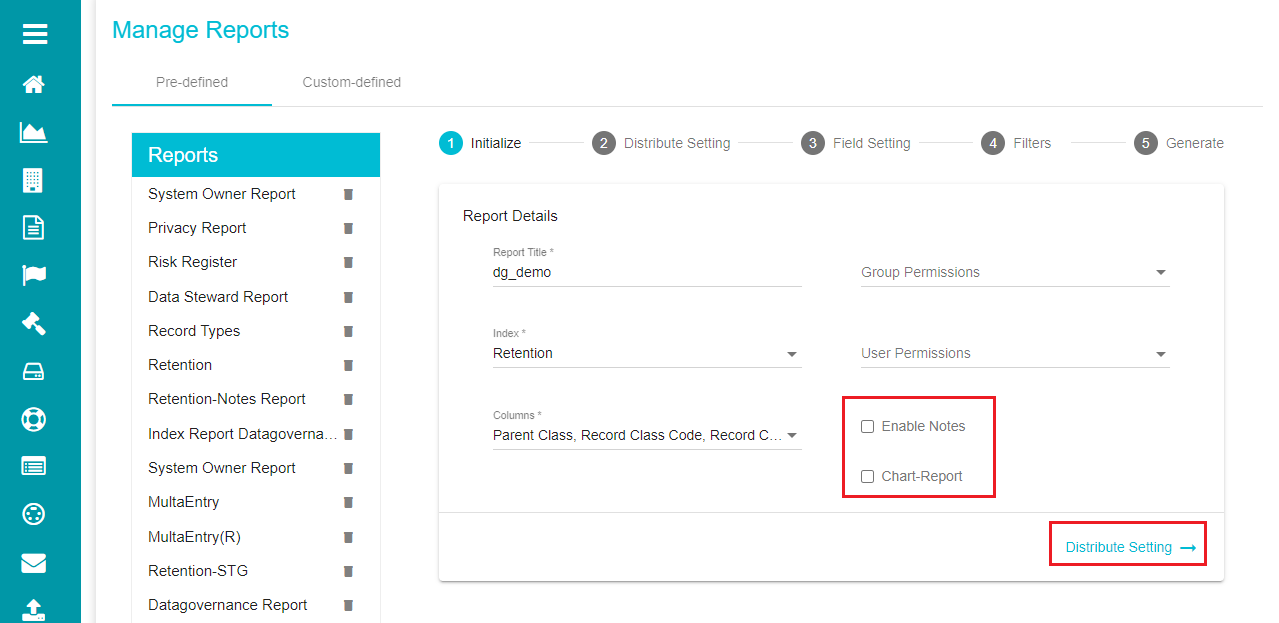
- Initialize:
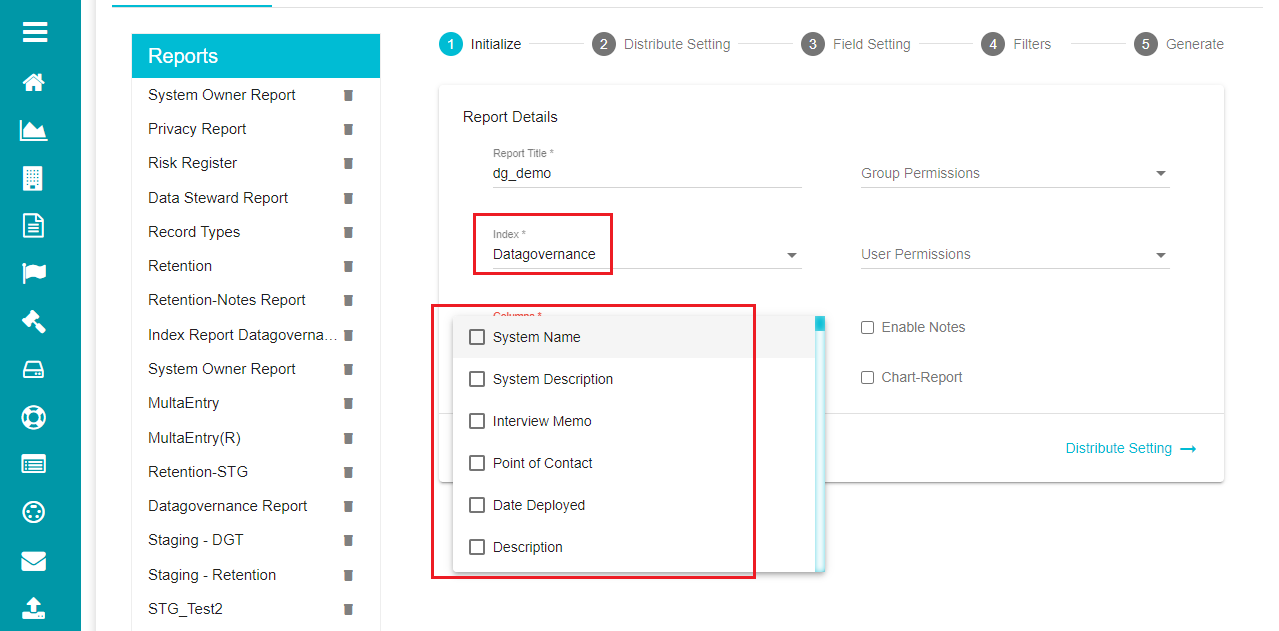
Here, you can add the report details, including the title, permissions, index, and columns.
Mandatory fields: These are the basic details that are to be provided for generating a report. A field with an * symbol is mandatory.
The available fields for pre-defined reports are:
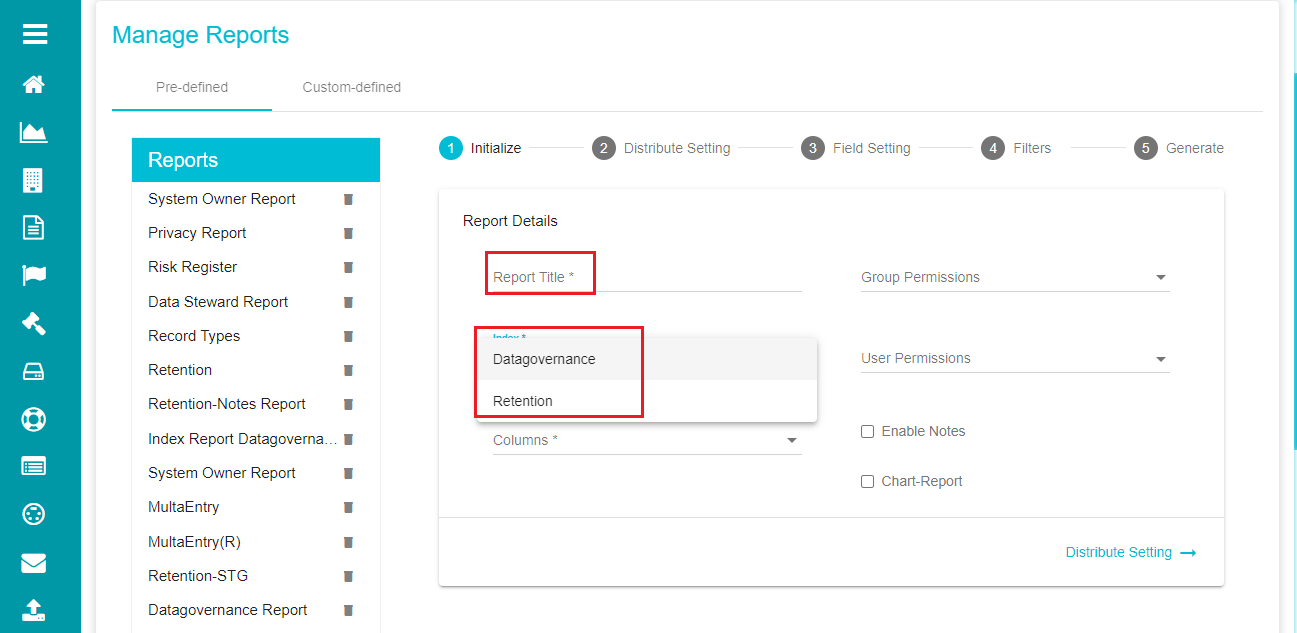
Report Title -- Assign a name to the report you are about to generate
Index -- The index is the category the report is to be generated from. This can be Data Governance or Retention.
Columns -- this is a drop-down menu varying based on the index chosen, i.e., the columns would be different for Data Governance and Retention.
The Retention index has the following columns.
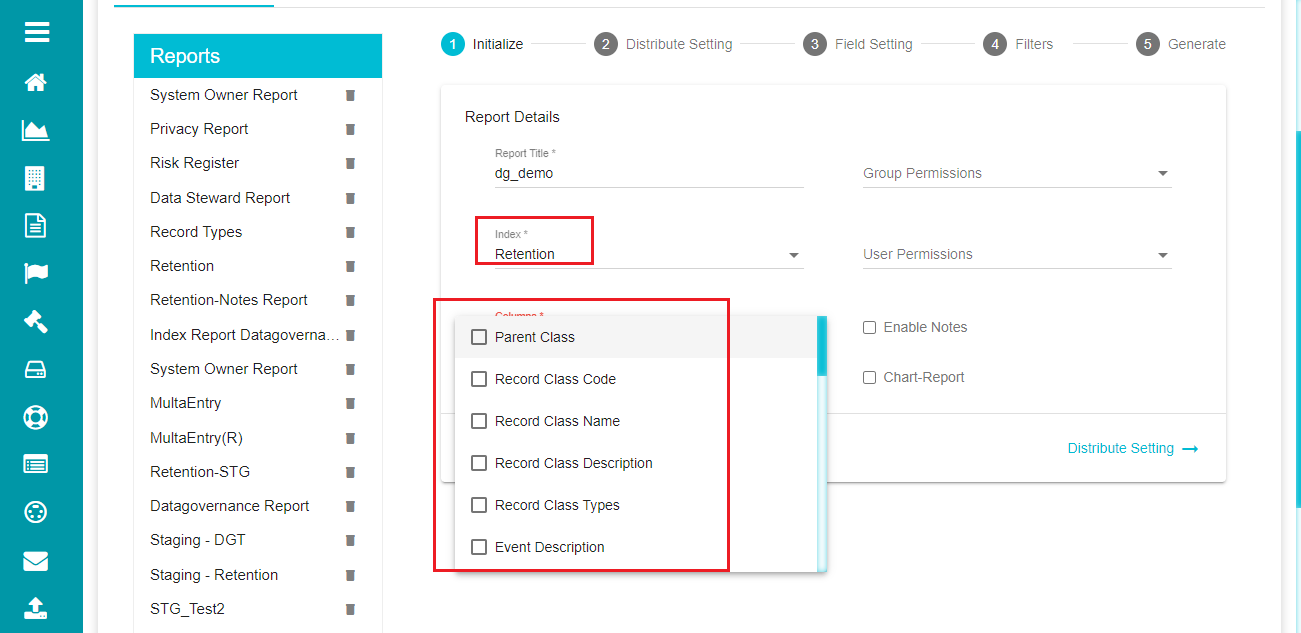
- Choose the columns that you want your report to have, from the Columns drop-down menu.
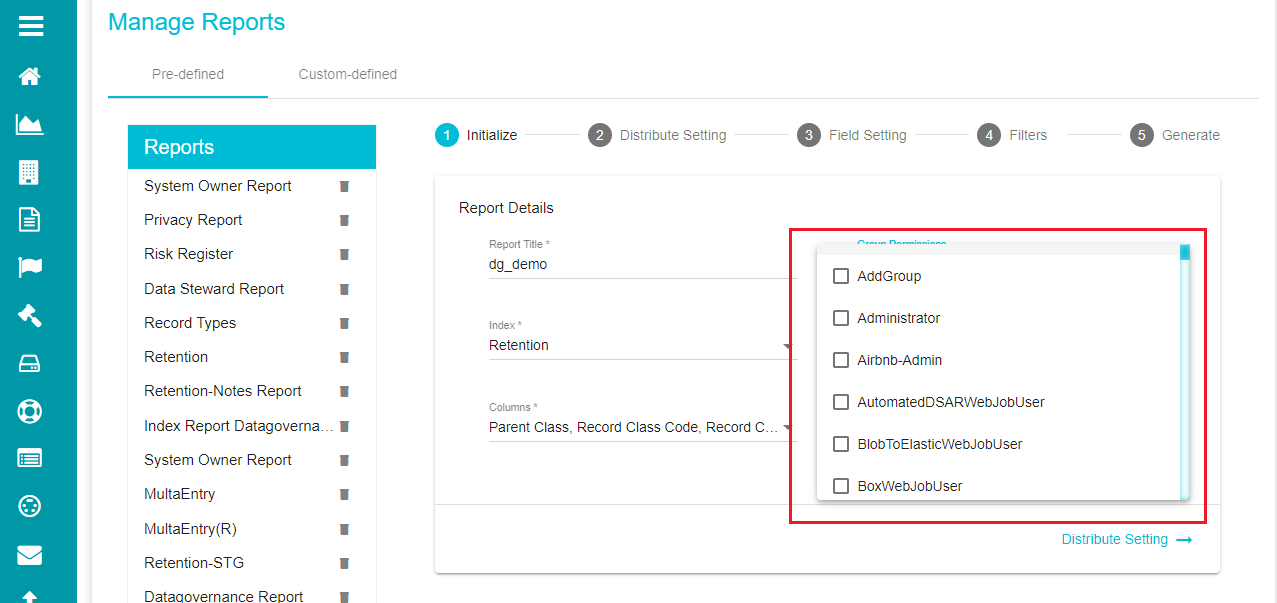
Group Permissions -- this drop-down menu allows you to select the groups that can have permission to view the report being created.
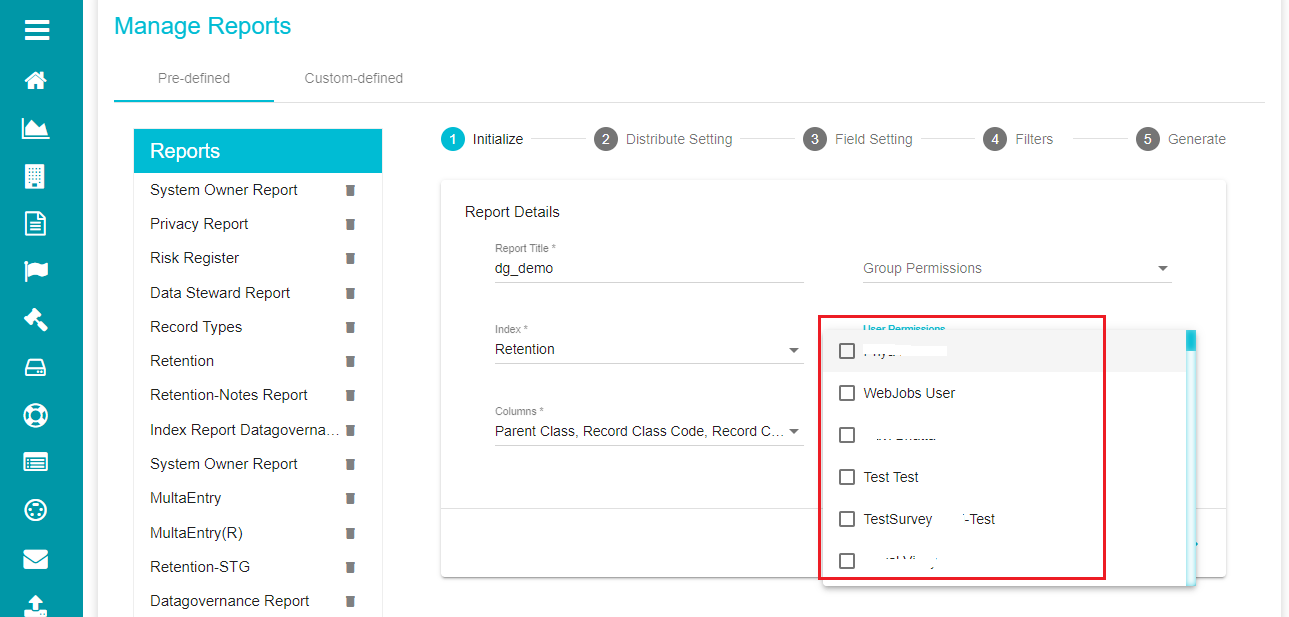
User Permissions -- this drop-down menu allows you to select the users that can have permission to view the report being created.
- Click on 'Group Permissions' drop-down menu and select the required groups.
- Click on 'User Permissions' drop-down menu and select the required users.
Enable Notes -- this option can be enabled if you want to add notes to a report after generating it. A new column would appear on the reports grid when this option gets enabled.
Chart-Report -- enabling this option generates the reports in charts, instead of grids. The Filters option is disabled in this case.
- Click on the 'Distribute Setting ' option to go to the next page.
- Distribute Setting
This screen provides options for distributing the report through email.
- Check the box next to 'Enable Distribution' to distribute the report via email.
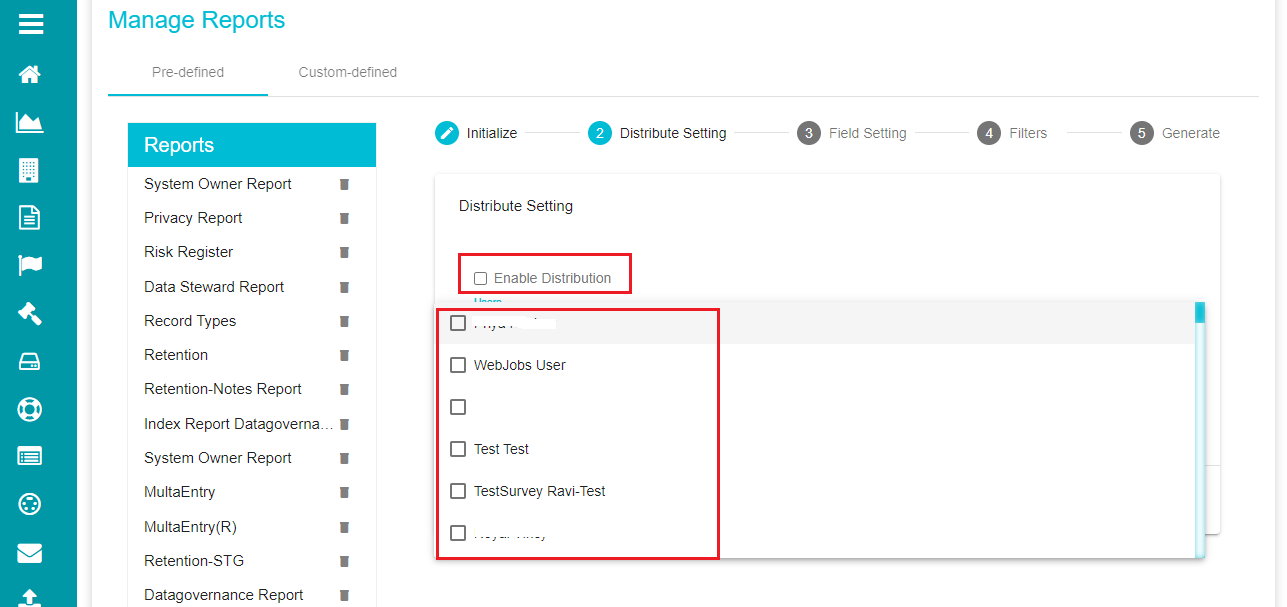
Users -- select the usernames from the list for sharing the report. The field supports multiple selections.
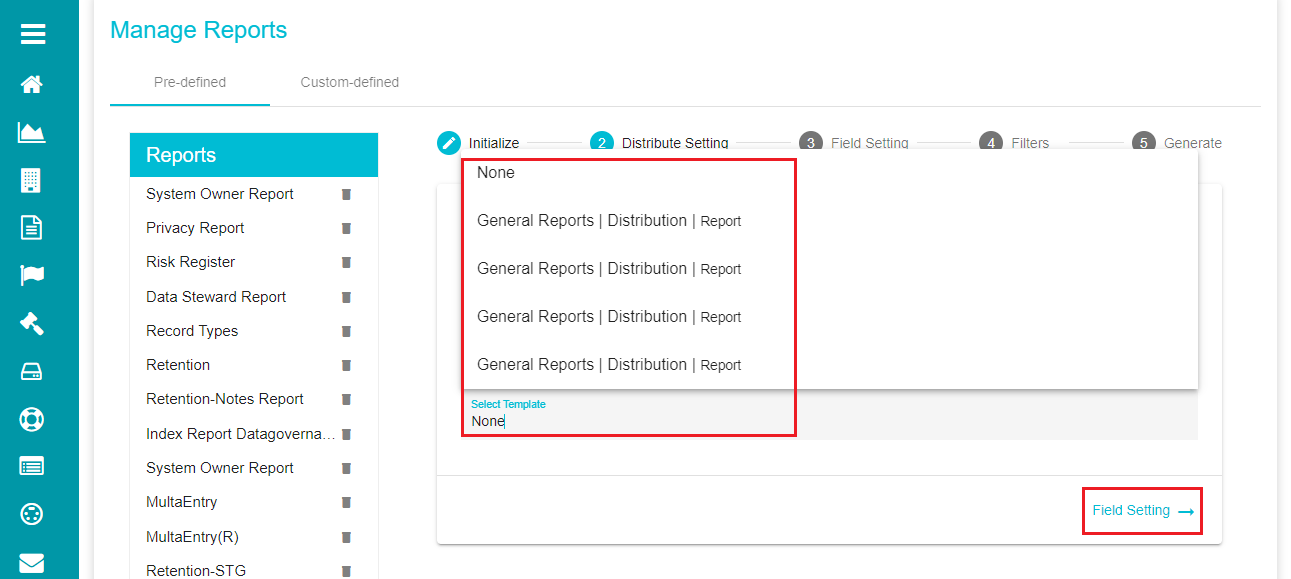
Select Template -- the templates determine the distribution frequencies (Hourly or Monthly) of the report. The frequency should be chosen based on the number of times the report has to be distributed via email.
Note: Admins can create additional templates based on the requirement.
- Click on 'Field Setting ' on the screen after defining these options.
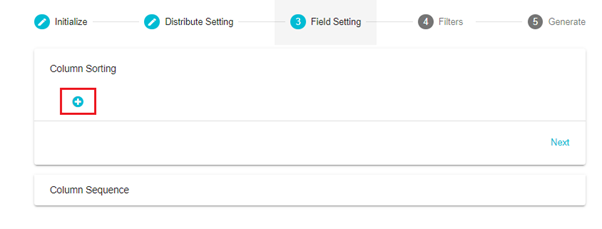
- Field Setting
This section allows the sorting of the rows and columns in the report.
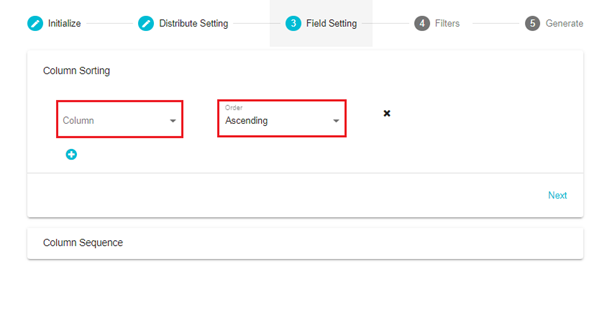
Column Sorting -- provides the option to choose the order (ascending or descending) of a particular column in the report.
- Click on the "+" symbol.
Choose the Column from the 'Column' dropdown.
Choose the 'Order' of sorting (ascending/ descending).
Any additional columns can be added by clicking the "+" symbol.
Delete any column by clicking the "X" symbol beside that column.
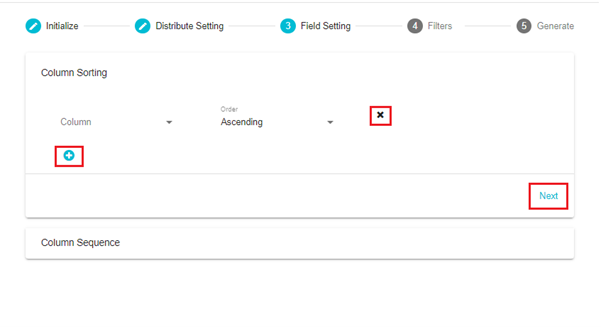
- Click Next to go to Column Sequence.
Column Sequence -- provides the option to sort the columns in the report.
Here, you can see the columns that are visible in the report and choose to hide any columns.
- Hide a column by clicking and dragging it to the Hidden Columns side.
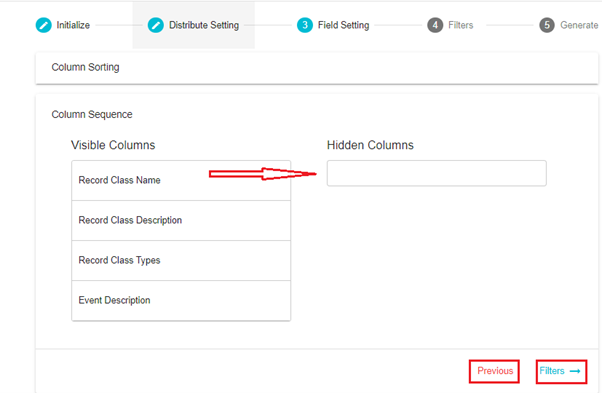
- Click Previous to go back to Column Sorting.
Click 'Filters ' to go to the next section.
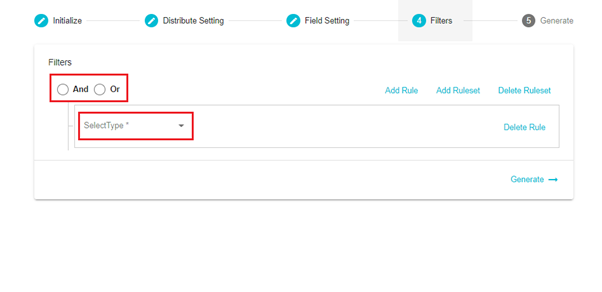
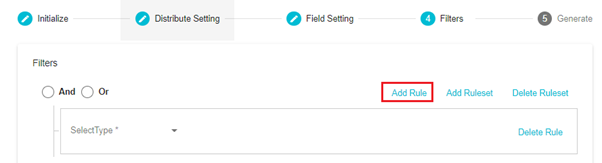
- Filters
This section allows to add condition(s) for filtering the reports.
Choose from the 'AND' or 'OR' ruleset.
Select the rule type from the drop-down menu.
- Choose criteria for the rule type from the drop-down menu.

- Add a value for the criteria

Add Rule -- The Add Rule option can be used to add a new rule for filtering.
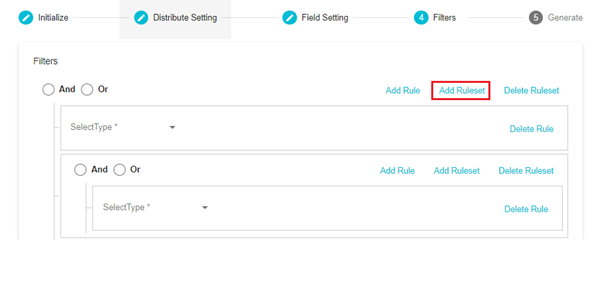
Add Ruleset -- This option can be used to create a new ruleset within a rule for additional filtering.
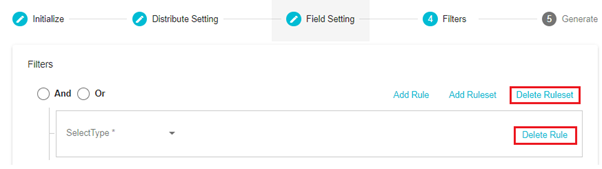
Delete Ruleset -- This option can be used to delete an existing ruleset created for additional filtering.
Delete Rule -- This option can be used to delete a rule created for filtering.
Click on 'Generate ' after defining all the rules for filtering.
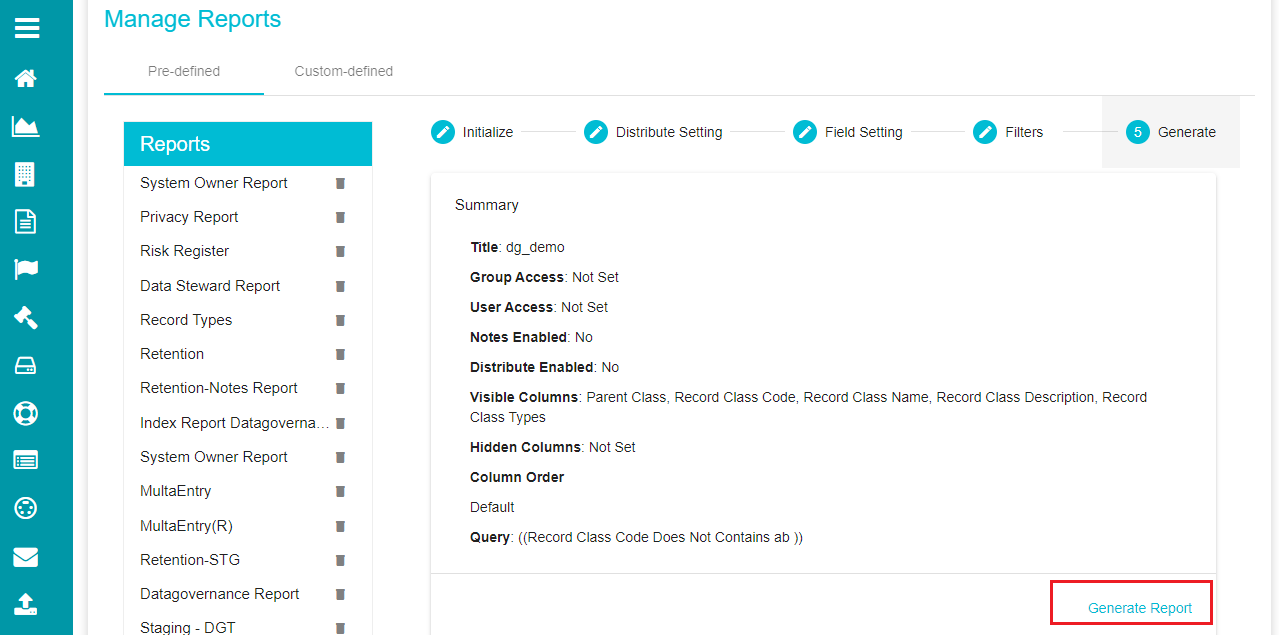
- Generate
Here, you will see a summary of the report being generated based on the selections that have been made.
- After confirming the summary, click 'Generate Report' for the system to go ahead with generating the report.
Note: You can go back to any of the four sections to make changes to the selections made. Just click the section name to go directly to the settings for the same.
Adding Notes
A new column appears on the grid after a report is created, when the 'Enable Notes', option is checked.
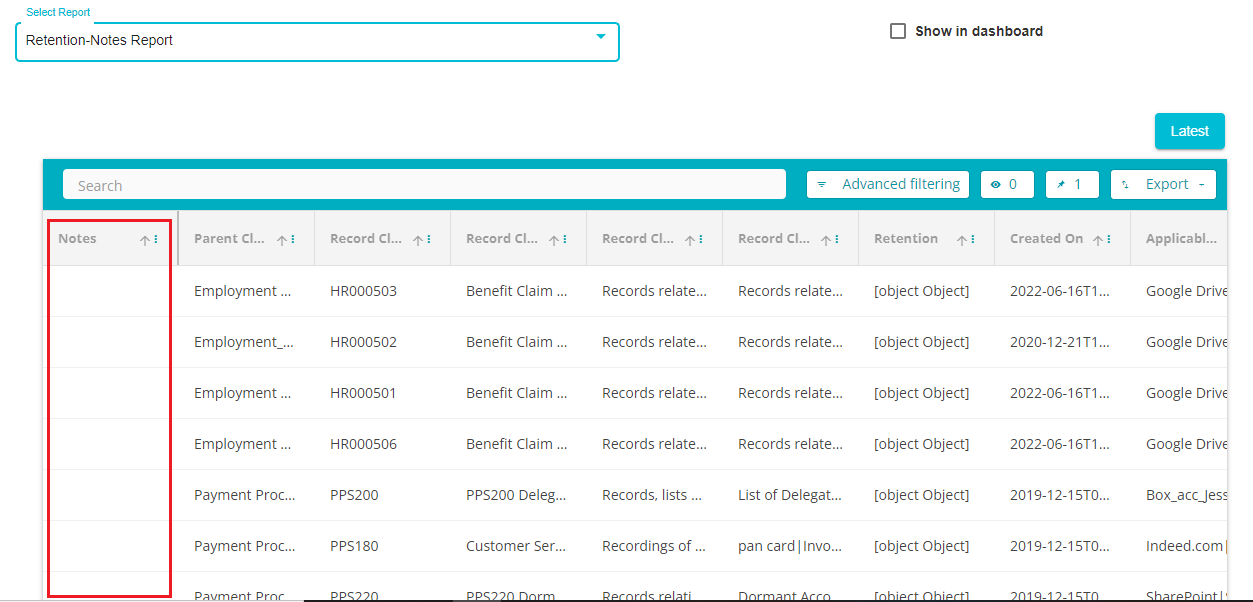
Right click on the Notes cell against the Record for which you want to add the notes.
The Notes section shows the options for Filter and New Post

The Filter option allows you to filter the existing Notes based on the following criteria:
Search Message and comments: Perform search using the keywords in the notes
Created by: Search for notes created by a user
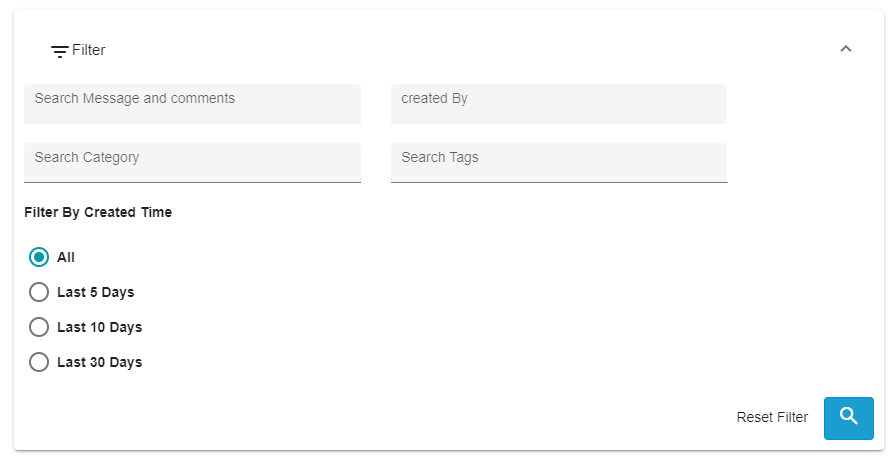
Search Category: Search for notes based on their category
Search Tags: Search for notes based on the Tags added to it
Filter by Created Time: Search for Notes based on their date of creation, e.g., All, Last 5 Days, Last 10 Days, Last 30 Days.
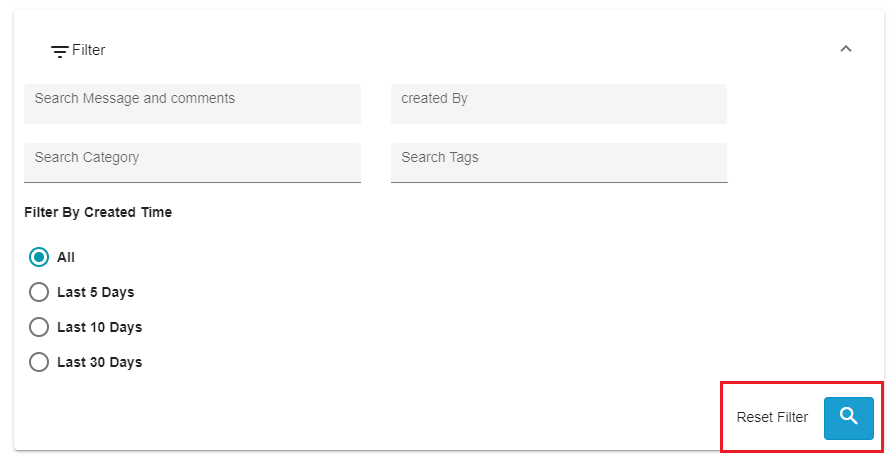
The Reset Filter option at the bottom of the page allows you to reset the search criteria.
Creating a New Note
- Click the New Post button under the Notes section

- A new window will appear on the screen with the following options.

- The Add a Post field is for adding the comments or annotations that you wish to share with the team.
Note: You can mention a user in the notes by adding the symbol "@" followed by the user's name. The Note will appear on the user's Dashboard, and they will also receive an email notifying them about the Note along with the link to access the Note.

- The Tags option allows you to add tags/labels to a note.

- Clicking on the X symbol on the top right corner will close the window and discard the Note

- The Categories
 button allows you to assign a
category for the note.
button allows you to assign a
category for the note.

The available categories are:
Todo (denotes a task to be performed).
Important (marks the Note as "important").
Question (denotes that a question has been posted for the team).
Idea (denotes that an idea has been posted for the team).
Critical (denotes that the Note has been labelled as "critical").

Based on the Tag assigned to the Note, the symbol for that respective category will appear at the bottom of that Note. For example, here we have created a Note with the comments "Test", tagged as "RRS", and the category "Important", which has been denoted with the symbol for the same.

- The Attach option allows you to add an attachment to the Notes.

- After drafting the notes and making the necessary changes, click the Send button to post the Note.

After posting the Note, you'll see the following options on the Note:
- The Archive option performs soft deletion of the Note.

- The Edit button can be used to make changes to the Note.

- The Delete button can be used to delete the Note.
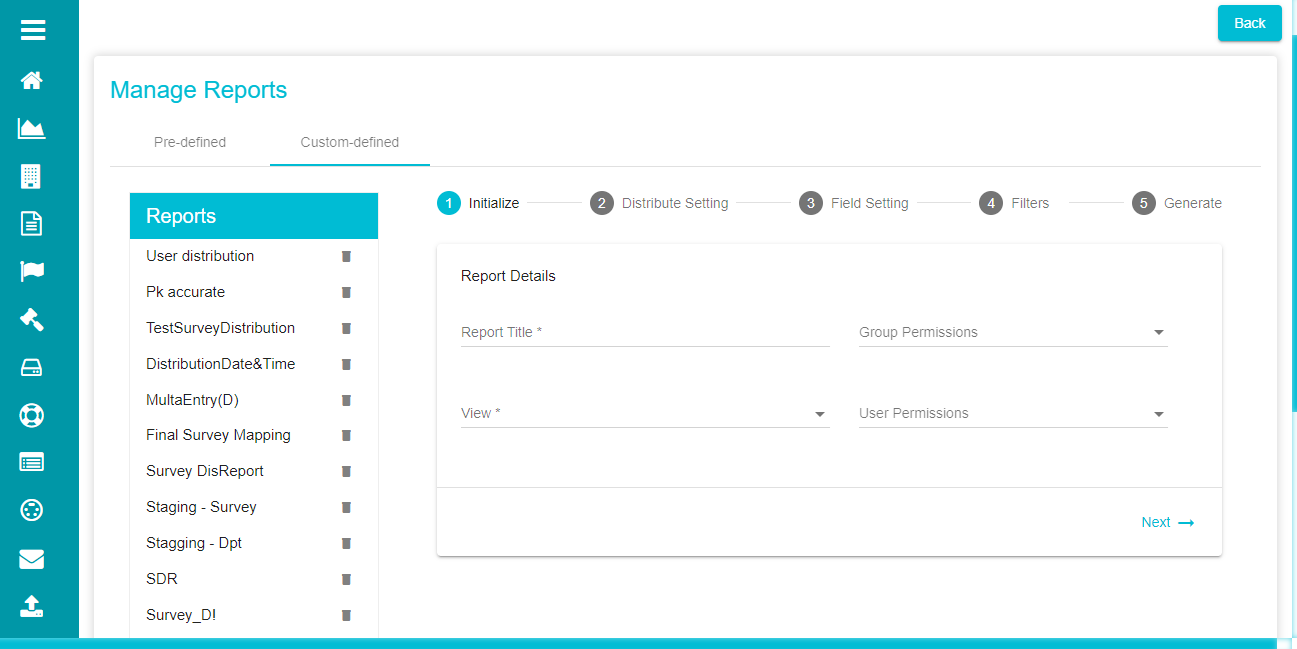
B) Custom-defined Reports
Custom-defined Reports are of two types -- Survey Distribution Report and Department Report.
Survey Distribution Report -- reports created for different survey distributions.
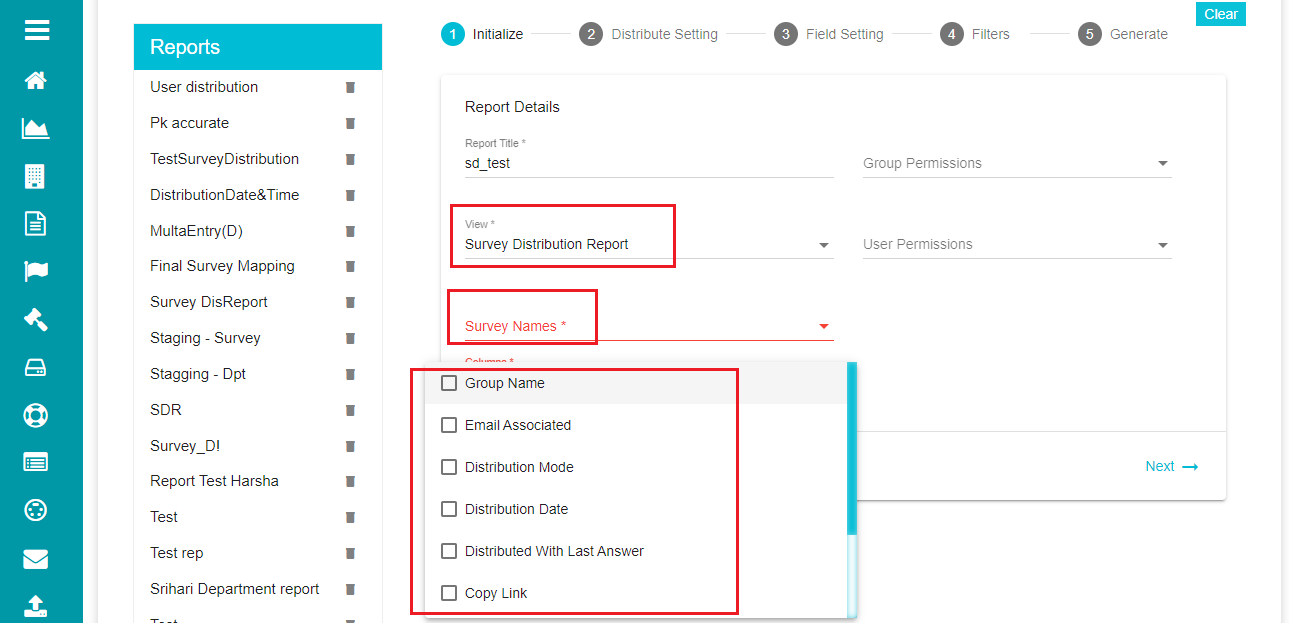
Selecting this option prompts two more selections -- survey names and columns.
Survey Names -- drop-down menu showing different survey names that can be included within the report.
Select the required survey names from the drop-down menu.
Select the required columns to be displayed on the report from the 'Columns' drop-down menu.
Note: Apart from these, the rest of the configuration remains the same as that of the pre-defined reports. So, you can follow the same steps to generate the report.
Department Report - reports created for different departments.
Selecting this option prompts the selection of the department requiring report generation.
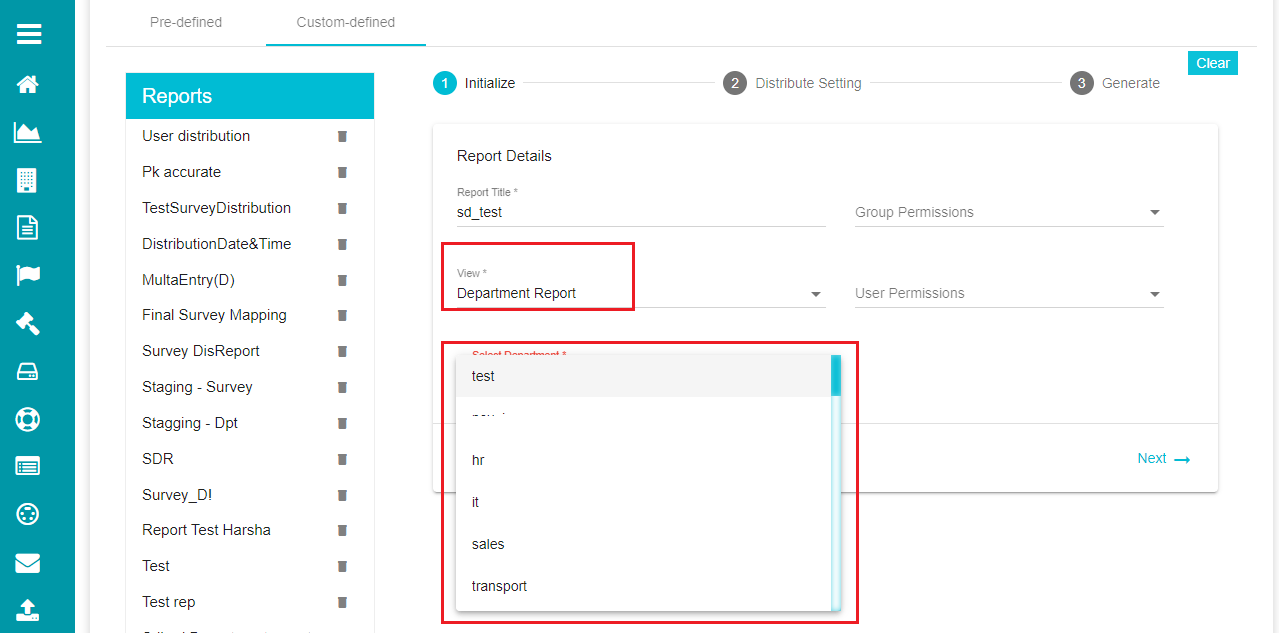
- Select required department from the drop-down menu.
Note: You cannot add Field Setting and Filters to the Department Reports. You can only configure the emails through the Distribute screen and generate the report through the Generate screen.
DSAR Report -- reports created for different DSA Requests.
For more details on configuring, viewing, and sending the DSAR Reports as emails, you can check this link - DSAR Reports (as emails).docx